Improving Comps Signal Early Progress in Grocery Outlet Turnaround
Grocery Outlet’s Q2 results showed improving comparable sales, stronger-than-expected earnings and a higher full-year outlook. The gains support early stabilization at the extreme-value retailer, but negative comps, lower margins and debt keep the turnaround incomplete.

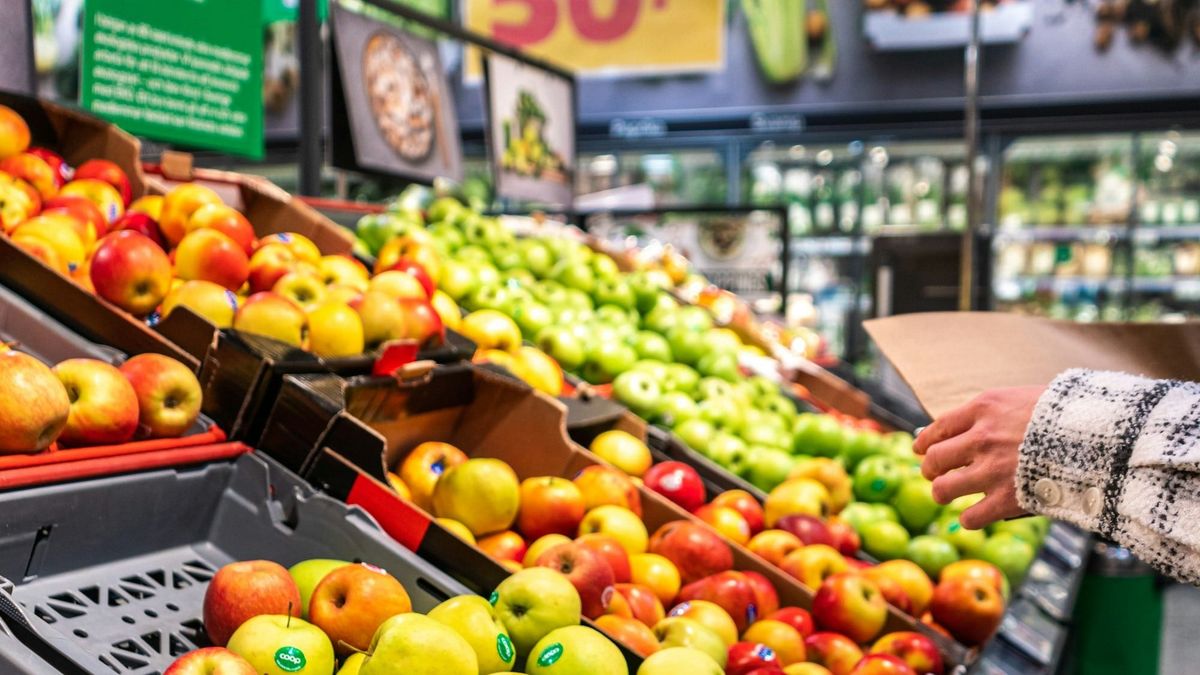
Grocery Outlet Shows Signs of Stabilization
Grocery Outlet (GO) is beginning to show measurable progress after a difficult period marked by weak comparable-store sales, underperforming locations and operational challenges.
Second-quarter revenue increased 1.1% year over year to $1.19 billion, while adjusted earnings of $0.20 per share exceeded expectations. Comparable-store sales remained negative, declining 0.3%, but improved from a 1.0% decline in the first quarter and turned positive during both May and June. Management also raised the low end of its fiscal 2026 revenue and adjusted EPS guidance.
Key Points
- Grocery Outlet's Q2 revenue increased 1.1% to $1.19 billion, while adjusted EPS of $0.20 exceeded expectations and prompted a modest increase to the low end of fiscal 2026 guidance.
- Comparable-store sales improved from a 1.0% decline in Q1 to a 0.3% decline in Q2, with comps turning positive during May and June.
- The turnaround remains incomplete as gross margin declined year over year, 36 underperforming stores were closed during the first half and the company carries about $506 million of debt.
Why Is Grocery Outlet Showing Signs of a Turnaround?
The strongest signal from Q2 was not headline revenue growth, but the improvement underneath it.
Comparable-store sales declined 0.3%, compared with a 1.0% decline during the first quarter. The Q2 result also included an approximately 0.5 percentage-point headwind from the timing of Easter. More importantly, Grocery Outlet said comparable sales turned positive during May and June.
Traffic increased 1.8%, providing another indication that customers were responding to changes underway at the retailer.
Those trends remain modest. Management is guiding third-quarter comparable sales to a decline of 1% to flat, while fiscal 2026 guidance calls for comps between a 0.5% decline and flat.
Still, the sequential improvement comes as Grocery Outlet works through a broader business optimization program introduced during the first quarter.
Management reported progress in sourcing, product flow, visibility and store-level execution. Expanded supplier relationships have also strengthened the company's assortment and product mix, while management is seeing early signs of customer response to a broader selection of deals.
Grocery Outlet plans to reinforce its value positioning with new in-store signage during Q3 and is introducing parity pricing in e-commerce.
That positioning could be particularly relevant as grocery shoppers become more price-conscious. Grocery Outlet operates as an extreme-value retailer, selling name-brand consumables and fresh products through more than 540 stores, primarily operated by independent operators.
Earnings and Guidance Give GO Stock a Lift
The market reaction to Q2 reflected improvement relative to expectations rather than a fully repaired business.
Adjusted EPS declined 13% year over year to $0.20, but significantly exceeded consensus expectations of roughly $0.12 to $0.13. Adjusted EBITDA reached approximately $65.7 million and also came in ahead of the company's outlook.
Net income increased to $5.6 million from approximately $5.0 million a year earlier.
Grocery Outlet subsequently lifted the low end of its fiscal 2026 outlook. The company now expects net sales of $4.70 billion to $4.72 billion and adjusted EPS of $0.51 to $0.55.
GO stock initially jumped 8.8% following the results before finishing that session up 5.2% at $10.78.
The reaction suggests the combination of better-than-expected profitability and higher guidance carried more weight than continued weakness in comparable sales and margins.
Gross margin illustrates that tension.
The measure declined to 30.2% from 30.6% a year earlier, although it exceeded Grocery Outlet's own Q2 expectations because promotional spending was lower than planned.
The company's ability to improve profitability while rebuilding traffic and its value proposition therefore remains an important part of the turnaround.
Store Closures Put Greater Focus on Execution
Grocery Outlet is also attempting to improve the underlying quality of its store portfolio.
The company closed 36 underperforming locations during the first half of 2026. Those closures reduce near-term revenue but remove weaker stores while allowing resources to be directed toward more productive locations.
The restructuring highlights some of the problems management is attempting to correct.
Grocery Outlet is still using approximately $20 million of temporary promotions during 2026 while rebuilding opportunistic sourcing. Capital expenditures remain elevated at approximately $170 million, while the company carries roughly $506 million of debt.
Operating cash flow has also declined year over year.
Those figures make the next stage of the turnaround dependent on more than simply generating positive traffic. Better sourcing, product assortment and store execution ultimately need to translate into more consistent comparable-store sales and stronger economics.
The company's recent results offer early evidence of improvement, but current guidance still anticipates subdued comparable sales.
What It Means for Investors
Grocery Outlet's Q2 results changed the direction of several important operating indicators without resolving the broader turnaround.
The improvement from a 1.0% comparable-sales decline in Q1 to a 0.3% decline in Q2 matters because it suggests deterioration has slowed. Positive comps during May and June and 1.8% traffic growth provide additional evidence that operational changes may be gaining traction.
At the same time, the company's financial picture still contains important constraints.
Gross margin remains below last year's level. Full-year comparable-store guidance remains between negative 0.5% and flat. The company has closed 36 stores, continues to spend on restructuring and promotions, and carries approximately $506 million of debt.
That leaves a relatively clear set of operating measures for assessing further progress: comparable-store sales, traffic, gross margin, sourcing improvements, store productivity and the company's ability to deliver against its higher fiscal 2026 guidance.
Grocery Outlet's extreme-value model also provides context for those metrics. With consumers increasingly focused on affordability, management believes its value proposition is well positioned. The operational question is whether the company can translate that positioning into sustained traffic and positive comparable sales.
The stock remains well below previous levels despite its recent recovery. At approximately $10.87, GO was 41.8% below its September 2025 52-week high of $18.66, even after gaining 6.8% since the beginning of 2026.
The recent price action therefore reflects improving expectations around a business that still has substantial ground to recover.
Conclusion
Grocery Outlet's second quarter provided some of the clearest evidence yet that its stabilization efforts are beginning to show up in operating results.
Revenue grew modestly, earnings exceeded expectations, traffic increased, comparable sales improved sequentially and management raised the low end of its fiscal 2026 outlook. Positive comps during May and June provide another encouraging data point heading into the second half.
But stabilization is different from a completed turnaround.
Comparable sales remained negative for Q2, gross margin declined from a year earlier, third-quarter guidance remains cautious and Grocery Outlet continues to work through store closures, restructuring, elevated capital spending and a meaningful debt load.
For GO stock, the central issue has therefore shifted from whether management can produce early signs of improvement to whether those signs can develop into sustained comparable-sales growth and stronger operating performance.
FAQs
Why did Grocery Outlet stock rise after Q2 earnings?
Grocery Outlet stock rose after adjusted EPS of $0.20 exceeded expectations, revenue reached $1.19 billion and management raised the low end of its fiscal 2026 revenue and adjusted EPS guidance. Shares initially gained 8.8% before closing the session 5.2% higher.
Are Grocery Outlet's comparable-store sales improving?
Yes. Comparable-store sales declined 0.3% in Q2, improving from a 1.0% decline in Q1, while the company reported positive comps during both May and June. Management still expects Q3 comps to range from a 1% decline to flat.
What is Grocery Outlet doing to improve its business?
Grocery Outlet is improving sourcing, product flow, supplier relationships, product assortment and store-level execution. It also closed 36 underperforming stores during the first half of 2026 and plans additional value-focused signage and e-commerce parity pricing.
What are the main challenges facing Grocery Outlet?
The main challenges include negative comparable-store sales, gross margin below last year's level, approximately $506 million of debt, elevated capital expenditures and the need to demonstrate that recent improvements can produce sustained positive comps.
What is Grocery Outlet's fiscal 2026 outlook?
Grocery Outlet expects fiscal 2026 net sales of $4.70 billion to $4.72 billion and adjusted EPS of $0.51 to $0.55. Full-year comparable-store sales are expected to range from a 0.5% decline to flat.
This article was created with AI assistance and reviewed by an editor. For details, please refer to our Terms of Use.
Go Beyond the Market Brief with Market Edge
Follow SharperTrades’ complete approach to trading and investing, combining active trade opportunities through Block Orders, long-term research through Stock Investor, and structured market education through the Swing Trading Masterclass. Try Market Edge for $19 your first month →
Explore Research with Stock Investor
Stock Investor is SharperTrades’ platform for long-term investing research and portfolio management. Members receive research reports, portfolio updates, conviction tracking, and in-depth analysis designed to support disciplined investment decisions.
Explore Active Trading & Income Strategies
Block Orders tracks institutional activity and highlights active trade setups and price behavior across long and short opportunities.
For options-focused traders, Essential Option Income provides a structured approach to options income strategies, while Pro Option Trader offers a broader range of options strategies and trade opportunities.
Think More Clearly with SteadyCapital
SteadyCapital is SharperTrades’ decision-support system for long-term investors, built around the SteadyCapital Method™. Review investment ideas, challenge assumptions, evaluate valuation and risk, compare companies, and think through important buy, hold, add, trim, or sell decisions before you act.
Risk Disclosure
All content is provided for educational purposes only and does not constitute investment advice. Trading involves risk, and past performance is not indicative of future results. Please review our full Risk Disclosure for additional information.